By Ken McEntee
U.S. scrap paper exports last year decreased by 13 percent, or almost 2.5 million short tons compared to 2019, according to trade data from the International Trade Commission (ITC). Exports totaled 15.8 million tons in 2020 compared to about 18.3 million tons in 2019.
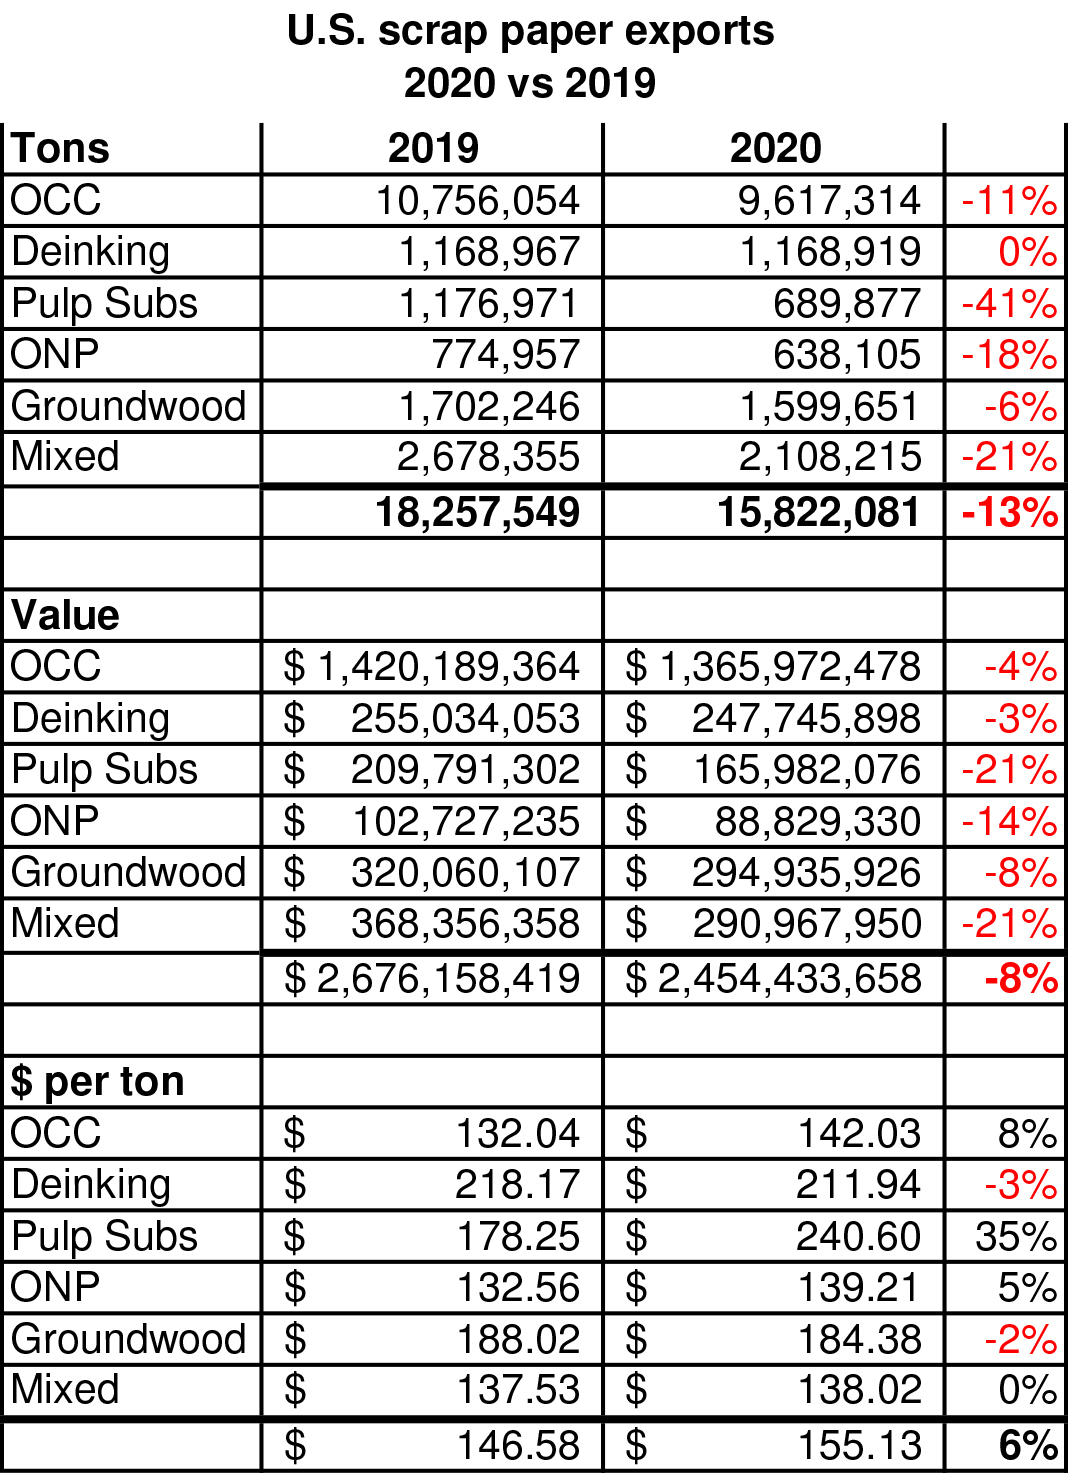
Source: The Paper Stock Report / International Trade Commission
While shipments of old corrugated containers (OCC) saw the heaviest decrease in terms of tonnage – more than 1.1 million tons – pulp subs took the heaviest hit in terms of percentage, dropping by 41 percent. Pulp subs and mixed paper each saw a 21 percent drop in dollar value of the tonnage shipped – the largest of any grade category.
While tonnage declined last year, the average FAS price of the shipments was up $9 per ton – or 6 percent – compared to 2019, to $155.13 per short ton. The average OCC price during the year was up $10 per ton, to $142.03 per ton, while pulp subs saw the largest gain – 35 percent, or $62 per ton, to an average of $240.60 per ton.
China down 1.1 million tons
Exports to China, which were banned by the Chinese government after the end of 2020, dropped 18 percent – or almost 1.1 million tons – during 2020, to a total of 4.8 million tons. That contrasted with an annual high of almost 15 million tons in 2015. During 2015, the U.S. shipped 8 million tons of OCC alone to China – a number that decreased to 3.5 million tons last year.
Exports to India, the next largest market, were down 28 percent, or 920,000 tons in 2020, for a total of almost 2.4 million tons. As China placed restrictions, and eventually a complete ban on imported scrap paper, India was frequently mentioned as a market that would pick up some of the displaced tonnage.
The largest growth was in exports to Malaysia. Shipments to that market improved by about 183,000 tons, or 92 percent, for a total of about 383,000 tons. Shipments to Singapore were up by about 109,000 tons, from about 2,300 tons, a gain of 4,579 percent. Vietnam was another significant growth market, pulling in almost 1.4 million tons, a gain of about 169,000 tons, or 14 percent, compared to 2019.
OCC exports
During its peak years, China typically accounted for around half of all U.S. OCC exports. In 2020, it made up about 36 percent, while the next two largest markets – Vietnam and India – made up about 25 percent.
OCC exports to China last year – which were restricted to double-sorted No. 12 OCC – totaled about 3.5 million tons, an 18 percent decline, or about 787,000 tons. Vietnam imported about 1.3 million tons – a 17 percent gain – for an improvement of about 185,000 tons. OCC exports to India were down 29 percent, or about 429,000 tons, for a total of just more than 1 million tons.
Exports to major markets Indonesia and Thailand also were down sharply in 2020, while shipments to Malaysia, Singapore and Mexico saw substantial increases. Laos, which never imported a ton of OCC from the U.S. before 2019, became the 16th largest market in the world last year, pulling in about 35,000 tons, up 245 percent compared to 2019. Meanwhile, OCC exports to Saudi Arabia plummeted 81 percent last year, from about 79,000 tons in 2019 to about 15,000 tons, representing one of the largest year-to-year declines for OCC. Another was a 96 percent drop in shipments to Guatemala, from about 33,000 tons in 2019 to about 1,300 tons.
Overall, OCC exports dropped 11 percent, or about 1.1 million tons, to about 9.6 million tons last year, compared to about 10.8 million tons in 2019.
Chemical deinking grades
Mexico, the dominant market for U.S. deinking grade exports, increased its buying by 16 percent relative to 2019. Mexico mills imported more than 750,000 tons of deinking grade fiber, a gain of more than 101,000 tons.
That improvement nearly offset reduced buying from Canada and India.
Deinking grade exports to Canada dropped 23 percent, or about 23,000 tons, to almost 79,000 tons, while shipments to India were down 60 percent, or almost 84,000 tons, to a total of almost 57,000 tons.
South Korea was the third largest market for deinking grades, with a heavy 273 percent gain from about 18,000 tons in 2019 to more than 67,000 tons in 2020.
Deinking grade shipments to Indonesia, a reasonably significant market in 2019, were down 71 percent, or almost 12,000 tons, to a total of less than 5,000 tons in 2020.
Overall, exports of deinking grades in 2020 fell a scant 47 tons below the total for 2019, a statistical dead heat.
Pulp subs
All major markets for pulp substitutes saw significant reductions in U.S. imports in 2020 relative to 2019. Overall, exports of pulp subs were down 41 percent, or nearly a half million tons in 2020.
Pulp subs exports to India, the largest market for the grade, were down 42 percent, or about 202,000 tons, to a total of almost 275,000 tons. Exports to Mexico were down 55 percent, of about 162,000 tons, to a total of about 135,000 tons. The United Arab Emirates, the third largest market for pulp subs, imported almost 63,000 tons, a 29 percent decline compared to 2019. Exports to Saudi Arabia made up more than half that decline, improving its import from 292 tons in 2019 to almost 15,000 tons last year.
Old newspapers
China, which was, for a long time the dominant market for old newspapers (ONP), dropped to the fourth position in 2020 due to a decline of almost 147,000 tons, or 65 percent, for a total of about 80,000 tons – down from 227,000 tons in 2019.
The largest market for ONP last year was South Korea, which increased its buying by 37 percent, or about 45,400 tons, to a total of about 170,000 tons. Exports to Mexico, the next largest ONP market, were down 12 percent, or about 16,000 tons, for a total of about 121,000 tons. Exports to Indonesia were up 44 percent, or about 33,400 tons, for a total of about 109,000 tons.
Overall, U.S. exports of old newspapers were down 18 percent in 2020, to about 638,000 tons.
Groundwood
Despite a 16 percent reduction in imports of U.S. groundwood grades other than ONP, China remained the dominant market for the category last year. Of a total of about 1.6 million tons, more than 1 million tons went to China. That, however, marked a drop of 16 percent, or about 208,000 tons compared to 2019. Thailand became the second largest market for groundwood in 2020, surpassing Canada, Taiwan and South Korea. Exports to Thailand were up 441 percent, or about 188,000 tons, to a total of about 231,000 tons.
Exports to Canada dropped by 40 percent, or about 52,000 tons, to a total of about 78,000 tons, while exports to South Korea dropped by 62 percent, or about 84,000 tons, to a total of about 52,000 tons.
Exports to Taiwan improved by 10 percent, to about 63,000 tons.
Overall, groundwood grade exports were down 6 percent compared to 2019.
Mixed paper
Despite an 18 percent reduction in mixed paper exports to India, that nation remained by far the largest market for the grade last year. Mixed paper exports to India were down by almost 200,000 tons, to a total of about 930,000 tons. Canada was the next largest market, at about 277,000 tons, a gain of 4 percent.
Despite a ban on mixed paper imports, China found a way to bring in about 149,000 tons of the grade, almost double its take in 2019.
Mixed paper exports to sizeable markets Indonesia and South Korea were down significantly in 2020. Exports to South Korea were down by more than half, from about 191,000 tons in 2019 to about 88,000 tons in 2020. Exports to Indonesia were down from about 208,000 tons in 2019 to 42,000 tons in 2020 – an 80 percent reduction.
Overall, mixed paper exports were down 21 percent, or more than a half million tons, last year, to a total of about 2.1 million tons.
Following are the U.S. exports to each global market in 2019 and 2020, by grade:
| OCC | Year 2019 | Year 2020 | Difference | Change |
| China | 4,282,674 | 3,495,940 | -786,734 | -18% |
| Vietnam | 1,117,540 | 1,302,819 | 185,280 | 17% |
| India | 1,483,829 | 1,054,653 | -429,176 | -29% |
| Taiwan | 793,368 | 824,252 | 30,884 | 4% |
| South Korea | 604,492 | 550,498 | -53,994 | -9% |
| Canada | 363,341 | 408,804 | 45,463 | 13% |
| Mexico | 239,712 | 383,400 | 143,688 | 60% |
| Malaysia | 101,886 | 345,970 | 244,083 | 240% |
| Indonesia | 667,468 | 335,335 | -332,133 | -50% |
| Thailand | 375,887 | 297,334 | -78,552 | -21% |
| Singapore | 2,372 | 110,436 | 108,064 | 4557% |
| Burma | 101,440 | 66,250 | -35,190 | -35% |
| Netherlands | 35,279 | 55,684 | 20,405 | 58% |
| Ecuador | 39,485 | 49,840 | 10,355 | 26% |
| Germany | 38,280 | 44,145 | 5,865 | 15% |
| Laos | 10,002 | 34,459 | 24,456 | 245% |
| Japan | 53,090 | 31,450 | -21,640 | -41% |
| Spain | 28,218 | 28,896 | 678 | 2% |
| Italy | 54,779 | 27,603 | -27,176 | -50% |
| Colombia | 49,822 | 27,504 | -22,318 | -45% |
| Chile | 10,236 | 19,191 | 8,955 | 87% |
| Turkey | 9,567 | 18,018 | 8,451 | 88% |
| Saudi Arabia | 79,308 | 14,918 | -64,390 | -81% |
| Pakistan | 26,264 | 14,616 | -11,648 | -44% |
| El Salvador | 3,724 | 10,077 | 6,354 | 171% |
| Argentina | 29,686 | 9,777 | -19,909 | -67% |
| Brazil | 12,551 | 8,665 | -3,886 | -31% |
| Hong Kong | 2,679 | 8,586 | 5,907 | 221% |
| Philippines | 13,499 | 6,456 | -7,043 | -52% |
| United Kingdom | 16,024 | 4,749 | -11,275 | -70% |
| Paraguay | 224 | 4,510 | 4,286 | 1910% |
| Peru | 14,033 | 3,384 | -10,649 | -76% |
| Bangladesh | 8,072 | 2,428 | -5,644 | -70% |
| United Arab Em | 14,070 | 2,253 | -11,817 | -84% |
| Trin & Tobago | 8,295 | 1,953 | -6,343 | -76% |
| Egypt | 11,546 | 1,390 | -10,155 | -88% |
| Ghana | 0 | 1,366 | 1,366 | #DIV/0! |
| Dominican Rep | 4,006 | 1,307 | -2,699 | -67% |
| Guatemala | 32,542 | 1,284 | -31,259 | -96% |
| Austria | 0 | 1,155 | 1,155 | #DIV/0! |
| Belgium | 2,922 | 1,102 | -1,819 | -62% |
| Finland | 210 | 735 | 525 | 250% |
| Russia | 1,772 | 571 | -1,201 | -68% |
| Australia | 2,830 | 502 | -2,329 | -82% |
| Djibouti | 0 | 493 | 493 | #DIV/0! |
| Lebanon | 0 | 295 | 295 | #DIV/0! |
| Nigeria | 2,838 | 292 | -2,547 | -90% |
| New Zealand | 0 | 272 | 272 | #DIV/0! |
| Denmark | 266 | 261 | -6 | -2% |
| Venezuela | 429 | 221 | -208 | -48% |
| Panama | 206 | 216 | 10 | 5% |
| Norway | 0 | 204 | 204 | #DIV/0! |
| South Africa | 781 | 161 | -620 | -79% |
| Honduras | 0 | 139 | 139 | #DIV/0! |
| Bolivia | 0 | 124 | 124 | #DIV/0! |
| Belarus | 0 | 83 | 83 | #DIV/0! |
| Ireland | 21 | 83 | 62 | 295% |
| Christmas Is | 0 | 74 | 74 | #DIV/0! |
| Oman | 146 | 74 | -73 | -50% |
| Costa Rica | 1,134 | 47 | -1,087 | -96% |
| France | 0 | 19 | 19 | #DIV/0! |
| Anguilla | 803 | 0 | -803 | -100% |
| Greece | 23 | 0 | -23 | -100% |
| Kenya | 341 | 0 | -341 | -100% |
| Latvia | 307 | 0 | -307 | -100% |
| Morocco | 50 | 0 | -50 | -100% |
| Qatar | 78 | 0 | -78 | -100% |
| Sri Lanka | 949 | 0 | -949 | -100% |
| Sweden | 376 | 0 | -376 | -100% |
| Switzerland | 146 | 0 | -146 | -100% |
| Tanzania | 117 | 0 | -117 | -100% |
| Uruguay | 22 | 0 | -22 | -100% |
| TOTAL | 10,756,054 | 9,617,314 | -1,138,740 | -11% |
| Deinking | ||||
| Mexico | 649,914 | 751,281 | 101,367 | 16% |
| Canada | 101,762 | 78,865 | -22,898 | -23% |
| South Korea | 18,075 | 67,476 | 49,401 | 273% |
| India | 140,317 | 56,692 | -83,625 | -60% |
| Colombia | 46,676 | 46,519 | -157 | 0% |
| Netherlands | 29,348 | 36,438 | 7,090 | 24% |
| Italy | 62,689 | 34,615 | -28,074 | -45% |
| China | 2,477 | 12,439 | 9,962 | 402% |
| Guatemala | 2,114 | 10,883 | 8,769 | 415% |
| El Salvador | 13,091 | 8,125 | -4,967 | -38% |
| Turkey | 1,756 | 7,833 | 6,078 | 346% |
| Chile | 10,567 | 7,707 | -2,860 | -27% |
| Peru | 1,610 | 7,442 | 5,831 | 362% |
| Spain | 1,874 | 7,314 | 5,440 | 290% |
| Vietnam | 4,238 | 5,023 | 784 | 19% |
| Indonesia | 16,822 | 4,901 | -11,922 | -71% |
| Taiwan | 4,378 | 3,424 | -954 | -22% |
| Japan | 2,658 | 3,340 | 682 | 26% |
| Ecuador | 2,982 | 2,892 | -90 | -3% |
| Germany | 980 | 2,829 | 1,849 | 189% |
| United Arab Em | 6,837 | 2,159 | -4,677 | -68% |
| Thailand | 8,779 | 1,767 | -7,013 | -80% |
| Ghana | 94 | 1,756 | 1,662 | 1778% |
| Pakistan | 3,165 | 1,272 | -1,893 | -60% |
| United Kingdom | 733 | 1,079 | 347 | 47% |
| Belgium | 7,260 | 815 | -6,445 | -89% |
| Argentina | 281 | 737 | 457 | 163% |
| Dominican Rep | 1,051 | 642 | -408 | -39% |
| Egypt | 5,710 | 630 | -5,080 | -89% |
| Saudi Arabia | 5,415 | 571 | -4,844 | -89% |
| Bangladesh | 244 | 450 | 206 | 84% |
| Austria | 0 | 204 | 204 | #DIV/0! |
| Brazil | 1,762 | 185 | -1,577 | -90% |
| South Africa | 1,166 | 113 | -1,053 | -90% |
| Honduras | 0 | 109 | 109 | #DIV/0! |
| Latvia | 866 | 108 | -758 | -88% |
| Tunisia | 163 | 76 | -87 | -53% |
| Sierra Leone | 0 | 70 | 70 | #DIV/0! |
| Panama | 0 | 55 | 55 | #DIV/0! |
| Kenya | 157 | 41 | -117 | -74% |
| Malaysia | 108 | 25 | -83 | -77% |
| Uruguay | 0 | 21 | 21 | #DIV/0! |
| Br Indian O Ter | 48 | 0 | -48 | -100% |
| Bulgaria | 42 | 0 | -42 | -100% |
| Cen African Rep | 1,070 | 0 | -1,070 | -100% |
| Djibouti | 827 | 0 | -827 | -100% |
| Lithuania | 175 | 0 | -175 | -100% |
| Nicaragua | 23 | 0 | -23 | -100% |
| Philippines | 8,182 | 0 | -8,182 | -100% |
| Sweden | 55 | 0 | -55 | -100% |
| Switzerland | 426 | 0 | -426 | -100% |
| TOTAL | 1,168,967 | 1,168,919 | -47 | 0% |
| Pulp subs | ||||
| India | 476,687 | 274,417 | -202,270 | -42% |
| Mexico | 296,894 | 134,552 | -162,342 | -55% |
| United Arab Em | 87,946 | 62,614 | -25,332 | -29% |
| Canada | 64,441 | 51,255 | -13,187 | -20% |
| Netherlands | 63,452 | 28,457 | -34,995 | -55% |
| China | 33,152 | 26,996 | -6,156 | -19% |
| Italy | 29,127 | 16,644 | -12,483 | -43% |
| Saudi Arabia | 292 | 14,565 | 14,274 | 4897% |
| Japan | 16,564 | 13,497 | -3,067 | -19% |
| Chile | 9,895 | 11,101 | 1,207 | 12% |
| Peru | 6,150 | 9,799 | 3,649 | 59% |
| Pakistan | 2,224 | 9,211 | 6,987 | 314% |
| South Korea | 15,248 | 7,667 | -7,581 | -50% |
| El Salvador | 10,277 | 5,926 | -4,352 | -42% |
| Ecuador | 1,577 | 4,645 | 3,068 | 194% |
| Colombia | 14,439 | 4,601 | -9,837 | -68% |
| Spain | 1,218 | 2,660 | 1,442 | 118% |
| Bangladesh | 0 | 2,438 | 2,438 | #DIV/0! |
| United Kingdom | 1,163 | 2,221 | 1,058 | 91% |
| Indonesia | 15,233 | 1,448 | -13,785 | -90% |
| Israel | 559 | 832 | 273 | 49% |
| Vietnam | 3,286 | 811 | -2,475 | -75% |
| Turkey | 4,147 | 645 | -3,502 | -84% |
| Ireland | 635 | 627 | -8 | -1% |
| Taiwan | 1,946 | 396 | -1,550 | -80% |
| Australia | 282 | 339 | 57 | 20% |
| Philippines | 1,615 | 293 | -1,322 | -82% |
| Czech Republic | 200 | 217 | 17 | 8% |
| Denmark | 235 | 200 | -35 | -15% |
| Guatemala | 4,890 | 183 | -4,707 | -96% |
| Bahrain | 0 | 138 | 138 | #DIV/0! |
| Malaysia | 1,569 | 109 | -1,460 | -93% |
| Germany | 750 | 99 | -651 | -87% |
| Switzerland | 0 | 97 | 97 | #DIV/0! |
| Thailand | 5,790 | 81 | -5,709 | -99% |
| Argentina | 1,725 | 78 | -1,647 | -95% |
| New Zealand | 0 | 21 | 21 | #DIV/0! |
| Belgium | 705 | 0 | -705 | -100% |
| Brazil | 226 | 0 | -226 | -100% |
| Dominican Rep | 98 | 0 | -98 | -100% |
| Egypt | 134 | 0 | -134 | -100% |
| Finland | 62 | 0 | -62 | -100% |
| Iceland | 187 | 0 | -187 | -100% |
| Kenya | 102 | 0 | -102 | -100% |
| Panama | 111 | 0 | -111 | -100% |
| Qatar | 292 | 0 | -292 | -100% |
| Russia | 22 | 0 | -22 | -100% |
| Togo | 21 | 0 | -21 | -100% |
| Uruguay | 1,406 | 0 | -1,406 | -100% |
| TOTAL | 1,176,971 | 689,877 | -487,094 | -41% |
| ONP | ||||
| South Korea | 124,247 | 169,646 | 45,399 | 37% |
| Mexico | 136,976 | 120,597 | -16,379 | -12% |
| Indonesia | 75,957 | 109,357 | 33,399 | 44% |
| China | 227,102 | 80,538 | -146,564 | -65% |
| India | 50,448 | 49,816 | -633 | -1% |
| Canada | 30,346 | 24,785 | -5,561 | -18% |
| Vietnam | 17,101 | 16,536 | -564 | -3% |
| Thailand | 30,327 | 10,485 | -19,842 | -65% |
| United Kingdom | 12,467 | 10,192 | -2,276 | -18% |
| El Salvador | 1,441 | 9,257 | 7,816 | 542% |
| Malaysia | 38,127 | 8,190 | -29,938 | -79% |
| Colombia | 4,937 | 6,127 | 1,190 | 24% |
| Germany | 4,833 | 5,542 | 708 | 15% |
| Chile | 304 | 3,147 | 2,844 | 937% |
| Taiwan | 937 | 2,332 | 1,395 | 149% |
| Pakistan | 516 | 1,511 | 996 | 193% |
| United Arab Em | 1,518 | 1,459 | -59 | -4% |
| Spain | 851 | 906 | 55 | 6% |
| Netherlands | 983 | 873 | -110 | -11% |
| Argentina | 4,462 | 856 | -3,606 | -81% |
| Italy | 904 | 776 | -129 | -14% |
| Ecuador | 713 | 724 | 11 | 2% |
| Philippines | 4,942 | 613 | -4,330 | -88% |
| Guatemala | 190 | 550 | 360 | 189% |
| Peru | 363 | 540 | 177 | 49% |
| Japan | 191 | 459 | 267 | 140% |
| Switzerland | 879 | 449 | -430 | -49% |
| Australia | 174 | 334 | 161 | 92% |
| Costa Rica | 119 | 330 | 211 | 178% |
| Latvia | 136 | 293 | 156 | 115% |
| Turkey | 149 | 264 | 116 | 78% |
| Saudi Arabia | 235 | 220 | -15 | -7% |
| Belgium | 107 | 165 | 58 | 55% |
| Singapore | 0 | 119 | 119 | #DIV/0! |
| Panama | 0 | 77 | 77 | #DIV/0! |
| Venezuela | 0 | 30 | 30 | #DIV/0! |
| Hong Kong | 34 | 12 | -22 | -65% |
| Belize | 190 | 0 | -190 | -100% |
| Brazil | 1,173 | 0 | -1,173 | -100% |
| Dominican Rep | 23 | 0 | -23 | -100% |
| Egypt | 553 | 0 | -553 | -100% |
| TOTAL | 774,957 | 638,105 | -136,852 | -18% |
| Groundwood | ||||
| China | 1,267,212 | 1,058,291 | -208,921 | -16% |
| Thailand | 42,633 | 230,465 | 187,833 | 441% |
| Canada | 129,730 | 77,666 | -52,064 | -40% |
| Taiwan | 57,473 | 62,999 | 5,526 | 10% |
| South Korea | 136,118 | 51,809 | -84,310 | -62% |
| United Kingdom | 0 | 33,606 | 33,606 | #DIV/0! |
| Indonesia | 1,188 | 28,084 | 26,896 | 2264% |
| Mexico | 10,775 | 13,941 | 3,167 | 29% |
| India | 15,608 | 9,420 | -6,188 | -40% |
| Vietnam | 2,134 | 8,815 | 6,681 | 313% |
| Netherlands | 2,684 | 5,132 | 2,448 | 91% |
| Guatemala | 11,366 | 4,084 | -7,282 | -64% |
| Italy | 1,228 | 3,684 | 2,456 | 200% |
| Japan | 4,517 | 3,012 | -1,505 | -33% |
| Chile | 5,259 | 2,143 | -3,116 | -59% |
| Germany | 264 | 1,948 | 1,684 | 638% |
| El Salvador | 3,346 | 1,225 | -2,121 | -63% |
| Pakistan | 0 | 803 | 803 | #DIV/0! |
| Colombia | 1,091 | 750 | -341 | -31% |
| Malaysia | 201 | 537 | 336 | 167% |
| Dominican Rep | 1,355 | 457 | -899 | -66% |
| Belize | 1,088 | 275 | -813 | -75% |
| France | 195 | 267 | 73 | 37% |
| United Arab Em | 0 | 188 | 188 | #DIV/0! |
| Belgium | 0 | 26 | 26 | #DIV/0! |
| Ecuador | 1,986 | 22 | -1,964 | -99% |
| Argentina | 9 | 0 | -9 | -100% |
| Costa Rica | 501 | 0 | -501 | -100% |
| Hong Kong | 396 | 0 | -396 | -100% |
| Peru | 327 | 0 | -327 | -100% |
| Saudi Arabia | 3,564 | 0 | -3,564 | -100% |
| TOTAL | 1,702,246 | 1,599,651 | -102,595 | -6% |
| Mixed | ||||
| India | 1,129,112 | 930,358 | -198,754 | -18% |
| Canada | 265,493 | 276,618 | 11,125 | 4% |
| China | 75,337 | 148,927 | 73,590 | 98% |
| Thailand | 111,406 | 102,695 | -8,711 | -8% |
| Mexico | 127,713 | 99,948 | -27,765 | -22% |
| South Korea | 190,869 | 87,927 | -102,941 | -54% |
| Taiwan | 137,044 | 62,766 | -74,278 | -54% |
| Pakistan | 17,146 | 53,702 | 36,556 | 213% |
| Indonesia | 207,671 | 42,070 | -165,602 | -80% |
| Argentina | 28,279 | 37,551 | 9,272 | 33% |
| Malaysia | 58,232 | 28,678 | -29,554 | -51% |
| Guatemala | 3,227 | 27,268 | 24,041 | 745% |
| Vietnam | 44,536 | 23,619 | -20,917 | -47% |
| Brazil | 1,602 | 22,507 | 20,906 | 1305% |
| Netherlands | 23,999 | 19,924 | -4,074 | -17% |
| Germany | 40,442 | 17,962 | -22,480 | -56% |
| Saudi Arabia | 36,902 | 17,863 | -19,039 | -52% |
| Colombia | 26,034 | 14,155 | -11,879 | -46% |
| Chile | 6,518 | 13,741 | 7,224 | 111% |
| El Salvador | 11,077 | 11,862 | 785 | 7% |
| Ecuador | 33,964 | 11,656 | -22,308 | -66% |
| Belgium | 24,138 | 9,457 | -14,682 | -61% |
| Peru | 8,593 | 7,784 | -810 | -9% |
| United Kingdom | 3,592 | 6,216 | 2,625 | 73% |
| Spain | 4,546 | 5,305 | 759 | 17% |
| Japan | 13,943 | 4,805 | -9,138 | -66% |
| Italy | 11,906 | 3,926 | -7,981 | -67% |
| United Arab Em | 3,157 | 3,383 | 226 | 7% |
| Israel | 4,863 | 3,204 | -1,659 | -34% |
| Philippines | 737 | 2,420 | 1,683 | 228% |
| Costa Rica | 2,995 | 1,636 | -1,360 | -45% |
| Dominican Rep | 1,113 | 1,433 | 320 | 29% |
| Egypt | 4,401 | 1,249 | -3,153 | -72% |
| France | 0 | 1,063 | 1,063 | #DIV/0! |
| Hong Kong | 80 | 719 | 639 | 796% |
| Ghana | 0 | 702 | 702 | #DIV/0! |
| Bangladesh | 1,598 | 683 | -915 | -57% |
| Burma | 0 | 633 | 633 | #DIV/0! |
| Singapore | 0 | 402 | 402 | #DIV/0! |
| Trin & Tobago | 696 | 337 | -360 | -52% |
| Portugal | 297 | 298 | 1 | 0% |
| Turkey | 8,067 | 288 | -7,779 | -96% |
| Sri Lanka | 23 | 163 | 140 | 605% |
| Lebanon | 243 | 138 | -106 | -43% |
| Suriname | 1,071 | 102 | -969 | -90% |
| Panama | 136 | 28 | -109 | -80% |
| Albania | 193 | 22 | -171 | -89% |
| Jamaica | 0 | 22 | 22 | #DIV/0! |
| Bahamas | 0 | 3 | 3 | #DIV/0! |
| Australia | 898 | 0 | -898 | -100% |
| Austria | 788 | 0 | -788 | -100% |
| Bolivia | 964 | 0 | -964 | -100% |
| Djibouti | 57 | 0 | -57 | -100% |
| Greece | 147 | 0 | -147 | -100% |
| Honduras | 547 | 0 | -547 | -100% |
| Nigeria | 686 | 0 | -686 | -100% |
| Russia | 118 | 0 | -118 | -100% |
| Tunisia | 149 | 0 | -149 | -100% |
| Ukraine | 99 | 0 | -99 | -100% |
| Uruguay | 899 | 0 | -899 | -100% |
| Venezuela | 15 | 0 | -15 | -100% |
| TOTAL | 2,678,355 | 2,108,215 | -570,140 | -21% |
| GRAND TOTAL | 18,257,549 | 15,822,081 | -2,435,468 | -13% |
| All Grades | Year 2019 | Year 2020 | ||
| China | 5,887,954 | 4,823,130 | (1,064,823) | -18% |
| India | 3,296,000 | 2,375,355 | (920,645) | -28% |
| Mexico | 1,461,985 | 1,503,720 | 41,735 | 3% |
| Vietnam | 1,188,834 | 1,357,623 | 168,790 | 14% |
| Taiwan | 995,146 | 956,170 | (38,976) | -4% |
| South Korea | 1,089,050 | 935,024 | (154,025) | -14% |
| Canada | 955,112 | 917,992 | (37,121) | -4% |
| Thailand | 574,822 | 642,828 | 68,006 | 12% |
| Indonesia | 984,339 | 521,193 | (463,146) | -47% |
| Malaysia | 200,123 | 383,508 | 183,385 | 92% |
| Netherlands | 155,746 | 146,508 | (9,238) | -6% |
| Singapore | 2,372 | 110,956 | 108,584 | 4579% |
| Colombia | 142,999 | 99,657 | (43,342) | -30% |
| Italy | 160,633 | 87,248 | (73,385) | -46% |
| Pakistan | 49,314 | 81,115 | 31,801 | 64% |
| Germany | 85,549 | 72,525 | (13,024) | -15% |
| United Arab Em | 113,528 | 72,056 | (41,472) | -37% |
| Ecuador | 80,706 | 69,779 | (10,927) | -14% |
| Burma | 101,440 | 66,882 | (34,558) | -34% |
| United Kingdom | 33,978 | 58,062 | 24,085 | 71% |
| Chile | 42,777 | 57,030 | 14,253 | 33% |
| Japan | 90,962 | 56,562 | (34,400) | -38% |
| Argentina | 64,440 | 48,998 | (15,442) | -24% |
| Saudi Arabia | 125,716 | 48,137 | (77,579) | -62% |
| El Salvador | 42,956 | 46,472 | 3,516 | 8% |
| Spain | 36,708 | 45,081 | 8,373 | 23% |
| Guatemala | 54,330 | 44,252 | (10,078) | -19% |
| Laos | 10,002 | 34,459 | 24,456 | 245% |
| Brazil | 17,313 | 31,357 | 14,044 | 81% |
| Peru | 31,076 | 28,948 | (2,129) | -7% |
| Turkey | 23,685 | 27,048 | 3,363 | 14% |
| Belgium | 35,132 | 11,565 | (23,566) | -67% |
| Philippines | 28,975 | 9,781 | (19,194) | -66% |
| Hong Kong | 3,189 | 9,317 | 6,128 | 192% |
| Bangladesh | 9,914 | 5,998 | (3,916) | -39% |
| Paraguay | 224 | 4,510 | 4,286 | 1910% |
| Israel | 5,422 | 4,036 | (1,386) | -26% |
| Dominican Rep | 7,646 | 3,839 | (3,807) | -50% |
| Ghana | 94 | 3,824 | 3,730 | 3989% |
| Egypt | 22,344 | 3,269 | (19,075) | -85% |
| Trin & Tobago | 8,991 | 2,289 | (6,702) | -75% |
| Costa Rica | 4,749 | 2,013 | (2,736) | -58% |
| Austria | 788 | 1,359 | 571 | 72% |
| France | 195 | 1,349 | 1,154 | 593% |
| Australia | 4,183 | 1,175 | (3,009) | -72% |
| Finland | 272 | 735 | 463 | 170% |
| Ireland | 656 | 710 | 54 | 8% |
| Russia | 1,912 | 571 | (1,341) | -70% |
| Switzerland | 1,451 | 546 | (905) | -62% |
| Djibouti | 884 | 493 | (392) | -44% |
| Denmark | 502 | 461 | (41) | -8% |
| Lebanon | 243 | 432 | 189 | 78% |
| Latvia | 1,309 | 400 | (909) | -69% |
| Panama | 453 | 375 | (78) | -17% |
| Portugal | 297 | 298 | 1 | 0% |
| New Zealand | – | 293 | 293 | #DIV/0! |
| Nigeria | 3,524 | 292 | (3,233) | -92% |
| Belize | 1,278 | 275 | (1,003) | -78% |
| South Africa | 1,947 | 274 | (1,673) | -86% |
| Venezuela | 444 | 251 | (194) | -44% |
| Honduras | 547 | 248 | (299) | -55% |
| Czech Republic | 200 | 217 | 17 | 8% |
| Norway | – | 204 | 204 | #DIV/0! |
| Sri Lanka | 972 | 163 | (810) | -83% |
| Bahrain | – | 138 | 138 | #DIV/0! |
| Bolivia | 964 | 124 | (839) | -87% |
| Suriname | 1,071 | 102 | (969) | -90% |
| Belarus | – | 83 | 83 | #DIV/0! |
| Tunisia | 311 | 76 | (235) | -76% |
| Christmas Is | – | 74 | 74 | #DIV/0! |
| Oman | 146 | 74 | (73) | -50% |
| Sierra Leone | – | 70 | 70 | #DIV/0! |
| Kenya | 601 | 41 | (560) | -93% |
| Albania | 193 | 22 | (171) | -89% |
| Jamaica | – | 22 | 22 | #DIV/0! |
| Uruguay | 2,327 | 21 | (2,306) | -99% |
| Bahamas | – | 3 | 3 | #DIV/0! |
| Anguilla | 803 | – | (803) | -100% |
| Br Indian O Ter | 48 | – | (48) | -100% |
| Bulgaria | 42 | – | (42) | -100% |
| Cen African Rep | 1,070 | – | (1,070) | -100% |
| Greece | 171 | – | (171) | -100% |
| Iceland | 187 | – | (187) | -100% |
| Lithuania | 175 | – | (175) | -100% |
| Morocco | 50 | – | (50) | -100% |
| Nicaragua | 23 | – | (23) | -100% |
| Qatar | 370 | – | (370) | -100% |
| Sweden | 431 | – | (431) | -100% |
| Tanzania | 117 | – | (117) | -100% |
| Togo | 21 | – | (21) | -100% |
| Ukraine | 99 | – | (99) | -100% |
Follow us on social media: